Redirecting to PayPal

Tailwind CSS Stats Components

Browse 285 ready-made Tailwind CSS stats components from multiple UI libraries. Every variant is fully responsive – copy the code or customize it in the visual editor and export clean code.

Generate Stats with AI

Stats from Bendis

Tailwind Stats Component

Four-column statistics row with blue icons and figures

A white horizontal section displaying four key metrics, each with a blue line icon, a large bold blue number, and a short uppercase caption. Items are evenly spaced in a single row on a light gray background.

Stats component #1
Stats component #2
Stats component #3

Stats from Metis

Tailwind Stats Component

Four-Item Statistics Row with Blue Icons

A horizontal row of four statistic items, each pairing a blue outlined icon in a light rounded tile with a bold numeric value and a gray label such as Followers, Solved Problems, Happy Customers, and Projects. It presents key metrics in a compact, minimal, light-background layout.

Stats component #1
Stats component #2
Stats component #3
Stats component #4
Stats component #5

Stats from Shuffle UX

Tailwind Stats Component

Four-column statistics row with icons and stat values

A horizontal row of four equal columns, each showing a circular outlined icon, a bold numeric statistic, and a light gray supporting caption on a white background. The layout presents key figures in a simple, evenly spaced stats strip.

Stats component #1
Stats component #2
Stats component #3

Stats from Cronos

Tailwind Stats Component

Four-column statistics strip with green line icons

A horizontal row of four statistics, each with a green outline icon, a large bold number, and a small gray label (Projects, Clients, Years of experience, Team Members). It is a simple informational stats section with no interactive controls.

Stats component #1
Stats component #2
Stats component #3

Stats from NEUB

Tailwind Stats Component

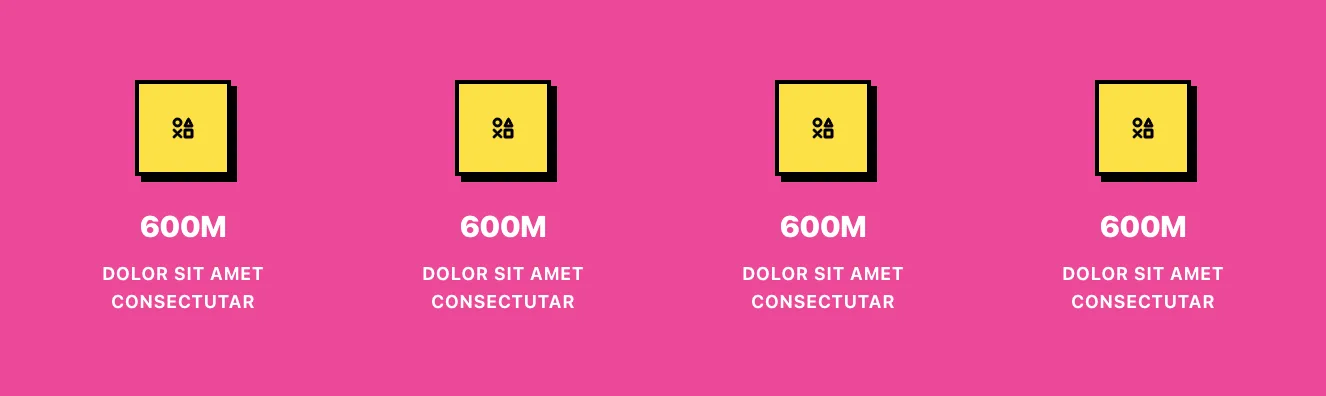
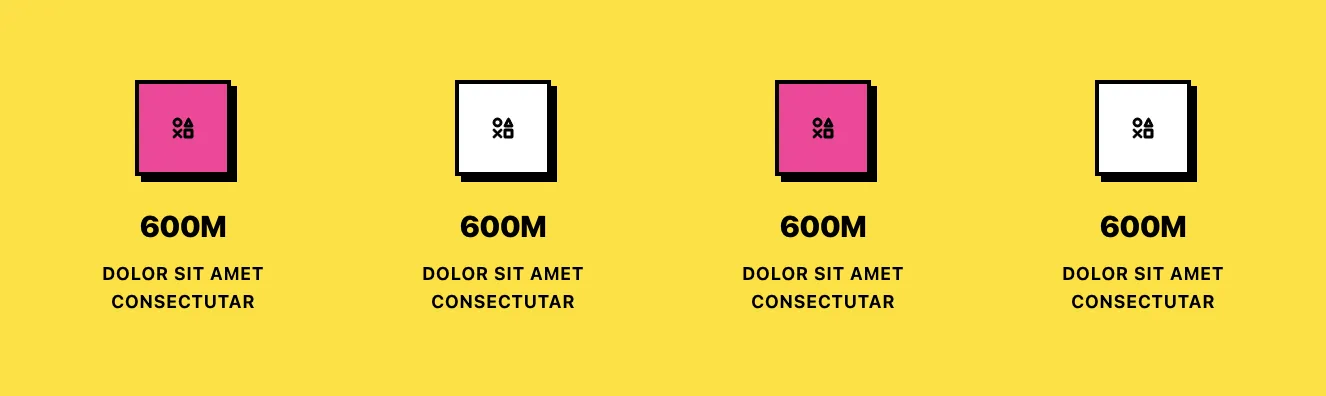
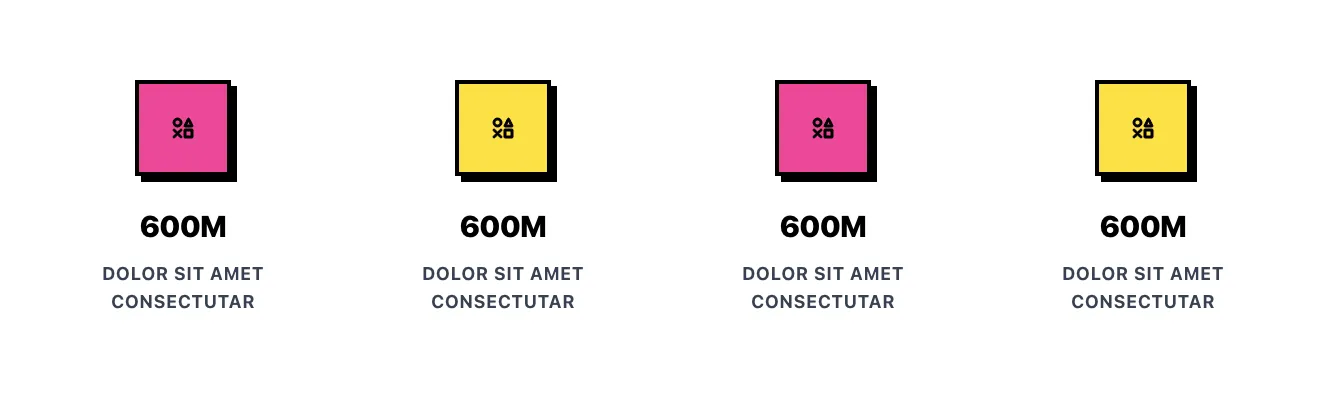
Four-Column Stats Row with Yellow Icon Tiles on Pink Background

A horizontal row of four identical stat items, each with a yellow square icon tile with black offset shadow, a bold white figure reading 600M, and two lines of uppercase white caption text. The layout is a simple evenly spaced horizontal row on a solid pink background.

Stats component #1
Stats component #2
Stats component #3
Stats component #4
Stats component #5
Stats component #6
Stats component #7
Stats component #8
Stats component #9

Stats from Casper

Tailwind Stats Component

Achievements stats section with three numeric metrics on dark gradient

A centered stats section on a dark blue-to-purple gradient background, with a large heading, short subtext, and three metric blocks (120 Partners Joined, 300+ Projects Done, 10+ Years of Experience) each paired with a colorful icon circle and separated by thin vertical dividers.

Stats component #1
Stats component #2
Stats component #3
Stats component #4
Stats component #5

Stats from Dashy

Tailwind Stats Component

Four-Up Stat Card Row with Metrics

A horizontal row of four white stat cards on a light gray background, each showing a centered label, a large bold numeric value, and a small 'Last updated 2 hours ago' timestamp. Used to display key business metrics at a glance.

Stats component #1
Stats component #2
Stats component #3
Stats component #4
Stats component #5
Stats component #6

Stats from Flow

Tailwind Stats Component

Four-column statistics row with large numeric metrics

A horizontal row of four centered statistics, each with a large numeric value and a small gray caption reading 'Renewable Energy Generated'. It presents key figures without any buttons or interactive controls, on a plain white background with a thin blue rule along the bottom edge.

Stats component #1
Stats component #2
Stats component #3
Stats component #4
Stats component #5
Stats component #6
Stats component #7
Stats component #8
Stats component #9
Stats component #10
Stats component #11
Stats component #12
Stats component #13
Stats component #14
Stats component #15

Stats from Vista

Tailwind Stats Component

Dark Stats Row with Revenue and Time Saved Metrics

A horizontal row of two key statistics on a dark background, each with a small label above a large bold figure, separated by a vertical accent bar. The left metric uses a pink bar to highlight customer revenue saved, and the right metric uses a muted gray bar for time saved.

Stats component #1
Stats component #2
Stats component #3
Stats component #4
Stats component #5
Stats component #6
Stats component #7
Stats component #8
Stats component #9
Stats component #10
Stats component #11
Stats component #12
Stats component #13
Stats component #14
Stats component #15

Stats from Cyber

Tailwind Stats Component

Four-Card Metric Stat Row with Gradient Numerals

A horizontal row of four dark, glass-style stat cards, each showing a circular icon, a large gradient-colored number of 600,000,000, and a spaced uppercase label such as Protocol Executions or Quantum Bits. Cards are staggered vertically with subtle gradient borders and small corner dots.

Stats component #1
Stats component #2
Stats component #3

Stats from Aurora

Tailwind Stats Component

Dark Stats Section with Green Metric Highlights

A dark-background marketing section headed by 'Let the numbers do the talking' with four centered green statistics (4.7, 2M+, 150+, 80%) and short gray labels beneath each. It is a promotional stats band with no interactive controls.

Stats component #1
Stats component #2
Stats component #3
Stats component #4
Stats component #5
Stats component #6
Stats component #7
Stats component #8
Stats component #9
Stats component #10
Stats component #11
Stats component #12
Stats component #13
Stats component #14
Stats component #15
Stats component #16
Stats component #17
Stats component #18
Stats component #19
Stats component #20
Stats component #21
Stats component #22
Stats component #23
Stats component #24
Stats component #25

Stats from Consulty

Tailwind Stats Component

Three-Column Dark Stats Section with Large Metrics

A dark full-width section displaying three centered statistics (5.2M, 17k, 99%) with bold headings and short body text beneath each. A faint large decorative background graphic sits behind the content, with no visible controls or interactive elements.

Stats component #1
Stats component #2
Stats component #3
Stats component #4
Stats component #5
Stats component #6
Stats component #7

Stats from Suncealand

Tailwind Stats Component

Big results statistics grid with serif heading

A white section titled "Big results" beside a 2x2 grid of large serif statistics, each with a colored underline bar and a short caption. It presents metrics in a minimal, spacious layout without interactive controls.

Stats component #1
Stats component #2
Stats component #3
Stats component #4
Stats component #5

Stats from Sirius Dashboard

Tailwind Stats Component

Three-Up Metric Stat Cards with 30-Day Badges

A row of three white bordered cards each showing a large numeric KPI (1450), an icon, a 30 DAYS badge, and a small trend label for messages or tasks with red down or green up change indicators. The layout is a horizontal row of equal-width cards used for summarizing analytics.

Stats component #1
Stats component #2
Stats component #3
Stats component #4
Stats component #5
Stats component #6
Stats component #7
Stats component #8
Stats component #9
Stats component #10
Stats component #11
Stats component #12
Stats component #13
Stats component #14
Stats component #15
Stats component #16
Stats component #17
Stats component #18
Stats component #19
Stats component #20
Stats component #21
Stats component #22
Stats component #23

In presenting data, it is important not to bore your audience. When showing larger data sets, it's a good idea to vary the presentation to keep users' attention. You can achieve this with a variety of ways to show data through our Tailwind component stats. Highlight the most important data and choose the right presentation for each data type!


Choose from many variations of the Tailwind components stats. The variants shown here are available in various UI libraries in the Shuffle editor. You will also find many other types of components that will be in the same style. This will allow you to build a comprehensive Tailwind website template. Each library is designed by a professional designer and coded by our team of developers.
 

Get access to all sections of the Tailwind components stats, code and our editor. Try the demo for free.

The easiest way to create beautiful websites

Black Weeks · Our best offer ▼

The selected plan includes lifetime access to Shuffle Editor.

Lifetime License

Create an account

OR USE EMAIL

Black Weeks pricing: our best offer of the year.

Why creators choose Shuffle

From idea to beautiful design in minutes.

Shuffle pairs an AI visual editor with 80+ UI libraries, so you can design, build and export production‑ready code without starting from scratch.

  • An AI Agent that builds with you Describe a page, watch it come to life, then fine-tune it visually or with a prompt.
  • Pick the best model for every task GPT-6 Astra, Claude Opus 5.5 and Gemini 4 Argon in one place.
  • 13,400+ professionally designed components Prefer building by hand? Drag in pixel-perfect sections crafted by professional designers.
  • Export to the stack you love Next.js, Astro, Laravel, WordPress, Shopify, static HTML and beyond.
“Its AI-powered features have transformed how I work! Designing and building websites has become faster, easier, and far more efficient.”
Est. 2019
Helping web builders ship since 2019 7 years of steady development.

Sign in to open the editor

Create a free account to customize this component visually and with AI.

Free account · No credit card · No password needed

Make it yours with AI

Start with this component. Tell AI what to change.

Original
Preview the original component.
Your Version
Available when your generation is complete.
Code
Available when your generation is complete.
Original component

Add images & videos

Upload an asset, then tell AI how to use it.

How it works

Your uploaded file will be added directly to the generated component. After uploading, you can guide the AI on where exactly to use it, e.g. as a logo or as a section image.

© 2026 Shuffle. All rights reserved.